Anatomy of Door County
A Traffic Safety Summary
Introduction
This document was created by the Division of State Patrol Bureau of Transportation Safety and Technical Services (BOTSTS). The data is based on three-year (2018 - 2020) trends.
The intention of this document is to assist Traffic Safety Commissions to examine their own transportation safety issues within their respective county and to identify potential countermeasures. While these crash and driver behavior trends are examined at the county level, these trends can be examined at a more local level. BOTSTS can provide this analysis and data to your local municipality.
For requests, email BOTSTS at CrashDataAnalysis@dot.wi.gov.
Zero in Wisconsin
![]()
WisDOT has adopted Zero in Wisconsin, the belief that no one should be killed or seriously injured from using the road network. The aim of Zero in Wisconsin (otherwise known as Safe System, Vision Zero or Sustainable Safety) is for a world free from road fatalities and serious injuries.
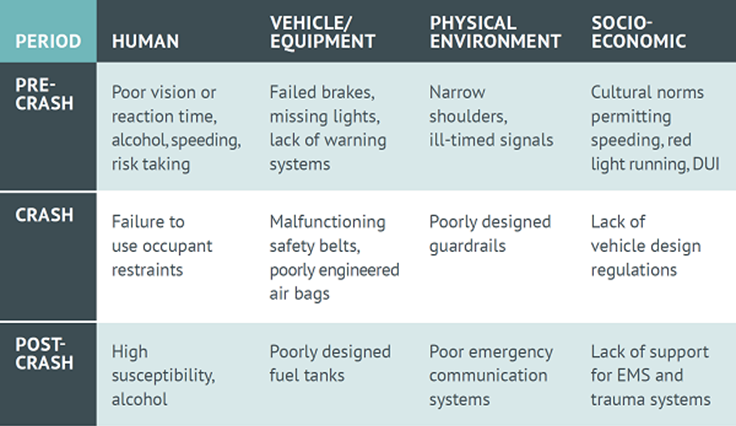
The Haddon Matrix (below) models basic principles to be applied to safety analysis. Each cell of the matrix represents a different area in which countermeasures can be implemented to improve traffic safety. Countermeasures applied to the pre-crash phase are designed to reduce the number of crashes. Countermeasures that are applied to the crash phase would not stop the crash, but could reduce the number or severity of injuries that occur as a result. Countermeasures focusing on the post-crash phase optimize the outcome for people with injuries, and prevent secondary events. Learn more about this approach at the Federal Highway Administration and Zero in Wisconsin.
Crash Trends
Per year in Door County, an average of
 |
While |
| 1,073 drivers are involved in a crash |  |
 |
November has the highest number of crashes |
| 177 people are injured |  |
|
July has the highest number of injury and fatal crashes |
| 5 people are killed |  |
| Where | 6 out of 10 injured or killed people are Door County residents |
 |
 |
| 6 out of 10 fatal and injury crashes occur on a county or state road | 17 out of 20 injured or killed people are Wisconsin residents |
| When | |
 |
|
| 3pm-4pm is the peak time for injury and fatal crashes |
Heat map of all crashes (2018 - 2020)
Explore crash hotspots in your local community in Community Maps. If you work for a public agency, you may request a log-in to gain access to advanced search and analysis capabilities.
On an average year in Door County, Saturday has the highest number of injury and fatal crashes. In addition, over a 24-hour period, injury and fatal crashes occur most frequently between 3pm-4pm peaking at 13 crashes in total throughout the year.
| Crash Type | 2016 | 2017 | 2018 | 2019 | 2020 | Trend |
|---|---|---|---|---|---|---|
| Fatal | 4 | 1 | 7 | 5 | 2 | |
| Injury | 139 | 142 | 132 | 123 | 103 | |
| Property Damage | 752 | 764 | 734 | 802 | 593 | |
| Total | 895 | 907 | 873 | 930 | 698 | - |
Here are trends of fatal, injury, and property damage crashes over the past 5 years.
Crashes on State roads are disproportionately represented in injury and fatal crashes. On roads with higher posted speed limits, there’s a higher risk for a severe injury or fatality if a crash were to occur.
Commuting Flows

Place of Residence

Place of Work
Total workers that work in Door County:²
12,346 ![]()
Of these, 89% also live in Door County
Place of Residence
Place of Work
Total workers that live in Door County:²
12,970 ![]()
Of these, 85% also work in Door County
Locals are more likely to be involved in a crash in Door County as opposed to visitors. 57% of occupants injured or killed in a crash in Door County also live in Door County.
Transportation Safety
Alcohol and Drug-Impaired Driving
In Door County, 22 people are injured or killed in a crash involving a driver believed to be impaired by drugs or alcohol, in an average year. That is 33% of all persons killed in a crash. Statewide, this is 33% of all persons killed.
While 71% of drivers believed to be impaired by drugs or alcohol are male.
Hotspots of alcohol and drug-related crashes with an injury or fatality (2018 - 2020)
Distracted Driving
In Door County, a driver being distracted is listed as a contributing factor in 12% of injury and fatal crashes. Statewide, this is 12% of injury and fatal crashes. Distracted driving is based on a two-year (2019-2020) trend due to a change in data fields. Below shows the breakdown of the factors in these distracted driving crashes.
Occupant Protection
Statewide seatbelt usage has been increasing over the past two decades. This past year experienced a usage rate of 89.2%, which is based on an annual seatbelt survey. Occupants not wearing a seatbelt are more likely to suffer a serious injury or fatality. Of the total statewide occupant fatalities, 1 out of 3 were not wearing a seatbelt. Statewide seatbelt usage rate reached an all time high in 2019.
People in your community can conduct their own seatbelt survey via the ‘Local Seatbelt Survey’ in the app store. 
Bicyclist and Pedestrian Safety
In the last 3 years in Door County, 6 cyclists and 8 pedestrians were killed or injured in 13 crashes. The below two bar charts shows the contributing factors and where these crashes occurred.
A bike or pedestrian crash is more likely to happen in an urban area, however, a fatal or serious injury crash is more likely to occur in a rural area due to higher speeds and due to further distance from a trauma center.
Locations of injury and fatal bicycle crashes
Locations of injury and fatal pedestrian crashes
Motorcycle Safety
In the last 3 years in Door County, 37 motorcyclists were killed or injured. Of these, 58% were not wearing a helmet.
Locations of injury and fatal motorcycle crashes
The type of helmet and other safety equipment worn, such as protective gear and gloves, can also impact the type of injury sustained.
33 motorcycle drivers were involved in a fatal or injury crash. 85% were Wisconsin drivers. Of these, 14% did not have a valid M endorsement.
Teen and Older Drivers
In Door County, teen or older drivers make up 29% of drivers involved in a fatal or injury crash. Statewide, this is 19% of drivers in fatal and injury crashes.
Breaking this down for Door County:
75 teen drivers make up 7% of drivers involved in a crash and make up 4% of licensed drivers and
231 older drivers make up 22% of drivers involved a crash and make up 35% of licensed drivers.
Locations of injury and fatal crashes involving a teen driver Locations of injury and fatal crashes involving an older driver
Lane Departure Crashes
More lane departure crashes occur in Door County, out of total injury and fatal crashes, compared to the state. That is an average of 57 fatal and injury lane departure crashes per year. Colliding with a Tree was the most frequent first harmful event. Breaking this up, 82% are single vehicle only, while statewide 75% are.
A lane departure crash is defined as when the driver crosses the centerline, edge line, or leaves the roadway and then usually colliding with another vehicle or an object, such as a guardrail or a tree. The cause of a lane departure crash could be a mixture of factors – speeding, being impaired by alcohol, or feeling tired.
Below shows the breakdown of the first harmful event in these lane departure crashes.
Speeding
Speeding includes both exceeding the speed limit and driving too fast for conditions. Speeding has a compounded affect in a crash; decreasing speed can reduce the crash risk, reduce injury severity, and make it possible to control the vehicle if an event were to occur. Of all fatal and injury crashes, 24% involved speed as a contributing factor resulting in 42 fatalities and injuries in an average year. Statewide, this is 20% of fatal and injury crashes.
Comparing to road type by lane miles, State roads are the most disportionate road type for fatal and injury speed crashes.
| Crash Type | 2016 | 2017 | 2018 | 2019 | 2020 | Trend |
|---|---|---|---|---|---|---|
| Fatal | 1 | 0 | 1 | 1 | 0 | |
| Injury | 33 | 40 | 31 | 31 | 27 | |
| Property Damage | 57 | 48 | 70 | 70 | 52 | |
| Total | 91 | 88 | 102 | 102 | 79 | - |
Here are trends of all speeding-related crashes over the past 5 years.
1 out of 4 of all crashes where speed is a factor involves a young driver.
Hotspots and analysis areas of all crashes involving a speeding driver
Appendix
Predictive Analytics
Predictive Analytics is an emerging program that uses established crash trends to identify “hotspots” in a particular locality. The program is geared to promote changes in driving culture in and around crash hotspots, with a particular focus on outreach. Utilizing a Safe Systems Approach, Predictive Analytics introduces multi-pronged solutions that involves a wide array of partners and stakeholders in traffic safety working together to reduce injury crashes.
Hotspot Selection
A county or municipality may use whatever method they decide to select their own hotspots. But utilizing Community Maps, a jurisdiction can target areas that have a demonstrated history of injury crashes. For example, using the search components on the left give us the following map, with several hotspots to choose between:
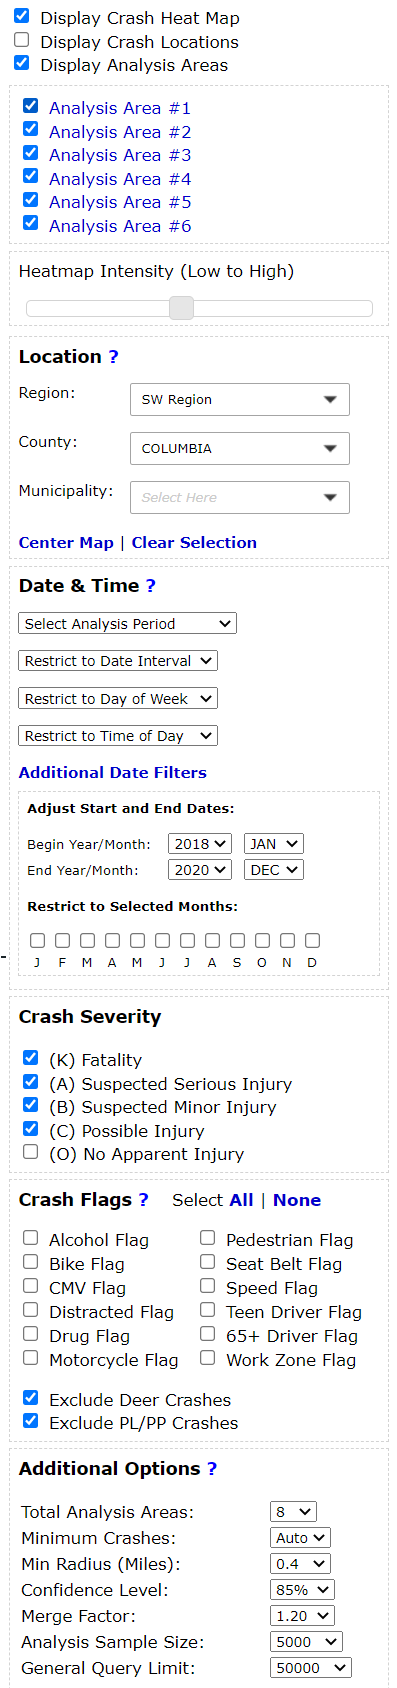
If there is a specific issue area that a locality wants to focus on (such as impaired driving or speeding), consider using specific crash flags when generating hotspots.
Urbanization
Door County is peninsular county adjacent to the Green Bay metropolitan area. The county includes approximately 300 miles of Lake Michigan coastline and several islands off the northern coast.
Vehicle Miles of Travel (VMT)3
A crash rate of ^
VMT is a measure of the total amount of and distance of vehicle travel in a year.
In Door County, the 2019 VMT was 501 million with a crash rate of 25 injury and fatal crashes per 100 million VMT, lower than the state’s rate of 42.
^Crash rate as measured by total injury and fatal crashes per 1 million vehicles miles traveled in 2019
Grants
The State Patrol Bureau of Transportation Safety and Technical Services (BOTSTS) administers federally funded overtime traffic safety grants to county task forces each year. A county task force is a group of law enforcement agencies working together to plan high visibility enforcement in their communities.
The overtime grants are awarded to agencies in task forces using a data driven targeting process. The targeting process includes a review of crash data from previous years to determine what areas have a traffic safety problem. The process is used to determine locations of concern in the areas of impaired driving, speeding, and unbelted vehicle occupants.
To save lives and reduce injuries by preventing traffic crashes, BOTSTS, in partnership with the National Highway Traffic Safety Administration (NHTSA), sponsors campaigns that mobilize hundreds of law enforcement agencies throughout the state to increase motorists’ compliance with traffic safety laws. The high-visibility law enforcement efforts are combined with effective media campaigns to get more motorists to buckle up, slow down and drive sober. The national mobilizations are Click it or Ticket and Drive Sober or Get Pulled Over.
| Agency | 2018 Drive Sober or Get Pulled Over - Winter Holidays | 2019 Click It or Ticket | 2019 Drive Sober or Get Pulled Over - Labor Day | 2019 Drive Sober or Get Pulled Over - Winter Holidays | 2020 Click It or Ticket | 2020 Drive Sober or Get Pulled Over - Labor Day |
|---|---|---|---|---|---|---|
| Baileys Harbor PD |
|
|
|
|
|
|
| Door County SO |
|
|
|
|
|
|
| Gibraltar Town PD |
|
|
|
|
|
|
| Sturgeon Bay PD |
|
|
|
|
|
|
| Washington Island PD |
|
|
|
|
|
|
No agencies participated in any task forces.
Abbreviations: DPS = Department of Public Safety, PD = Police Department, SO = Sheriff’s Office
Health Impacts and Medical Costs
Compared to Wisconsin, more people are in a crash in Door County (per 1,000 residents)4
and more people are hospitalized due to a crash (per 100,000 residents)4
While average medical costs per hospitalized person4 is lower
and fewer people died4 out of all occupants.
.
Injury-to-Fatality Ratio
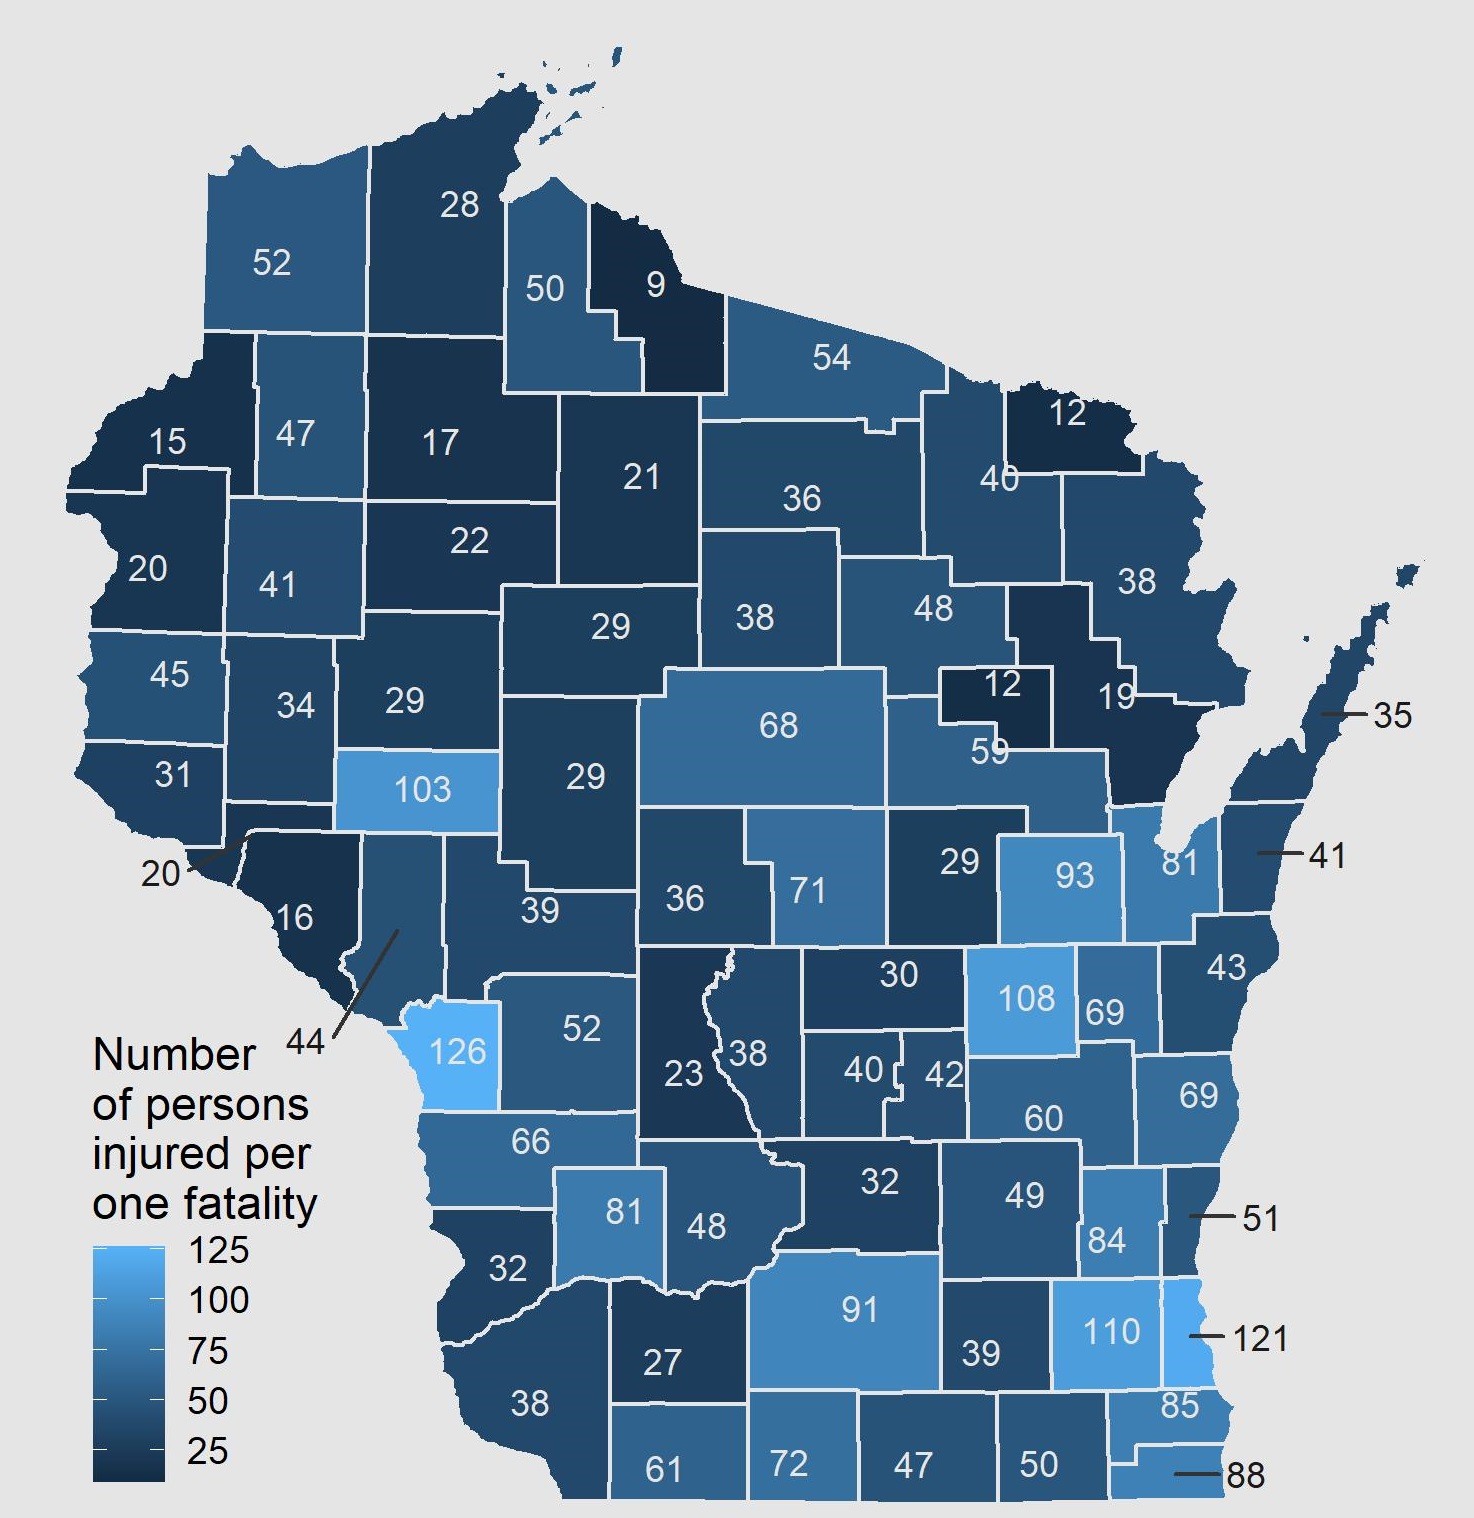
In Door County, for every 35 people injured, 1 person is killed. This is the injury-to-fatality ratio and is below average from Wisconsin where the ratio is 66 to 1.
The injury-to-fatality ratio is computed by dividing the total number of crash injuries by the total number of crash fatalities. A higher ratio is more ideal since fatalities comprise a smaller proportion of total crash victims. The ratio tends to be lower in rural areas where there’s a higher proportion of county and state roads. Higher speed limits means higher crash injury severity. Also rural areas generally suffer from a longer distance to hospitals and fewer emergency response services.
Sources:
1Wisconsin Department of Transportation. Received from K. Spencer. Dec. 3, 2019. wisconsindot.gov/Documents/projects/data-plan/veh-miles/vmt2016-c.pdf
2United States Census Bureau. 2011-2015 5-Year American Community Survey Commuting Flows. https://www.census.gov/data/tables/2015/demo/metro-micro/commuting-flows-2015.html Accessed Oct. 11, 2019.
3Wisconsin Department of Transportation. “2019 Vehicles Miles of Travel (VMT) by County.” Accessed May 20, 2021. https://wisconsindot.gov/Documents/projects/data-plan/veh-miles/vmt2019.pdf
4University of Wisconsin-Madison, Center for Health Systems Research & Analysis. Wisconsin Crash Outcome Data Evaluation System Project. 2013 - 2017. https://transportal.cee.wisc.edu/products/CODES/default.htm Accessed Oct. 11, 2019.